Numbers by Municipality
Halton Youth Impact Survey Results
Are recreation and leisure opportunities accessible to all children and youth in Halton?

Findings reflect the responses of 1915 youth in the 13 to 18 age range.
Explore the Numbers by Municipality
In the following sections on this page, you will find data points that can support planning for more inclusive recreation in your municipality. These indicators provide limited insight individually, but combined with the information you already have, they can help tell a story about community needs for accessible leisure and recreation opportunities.
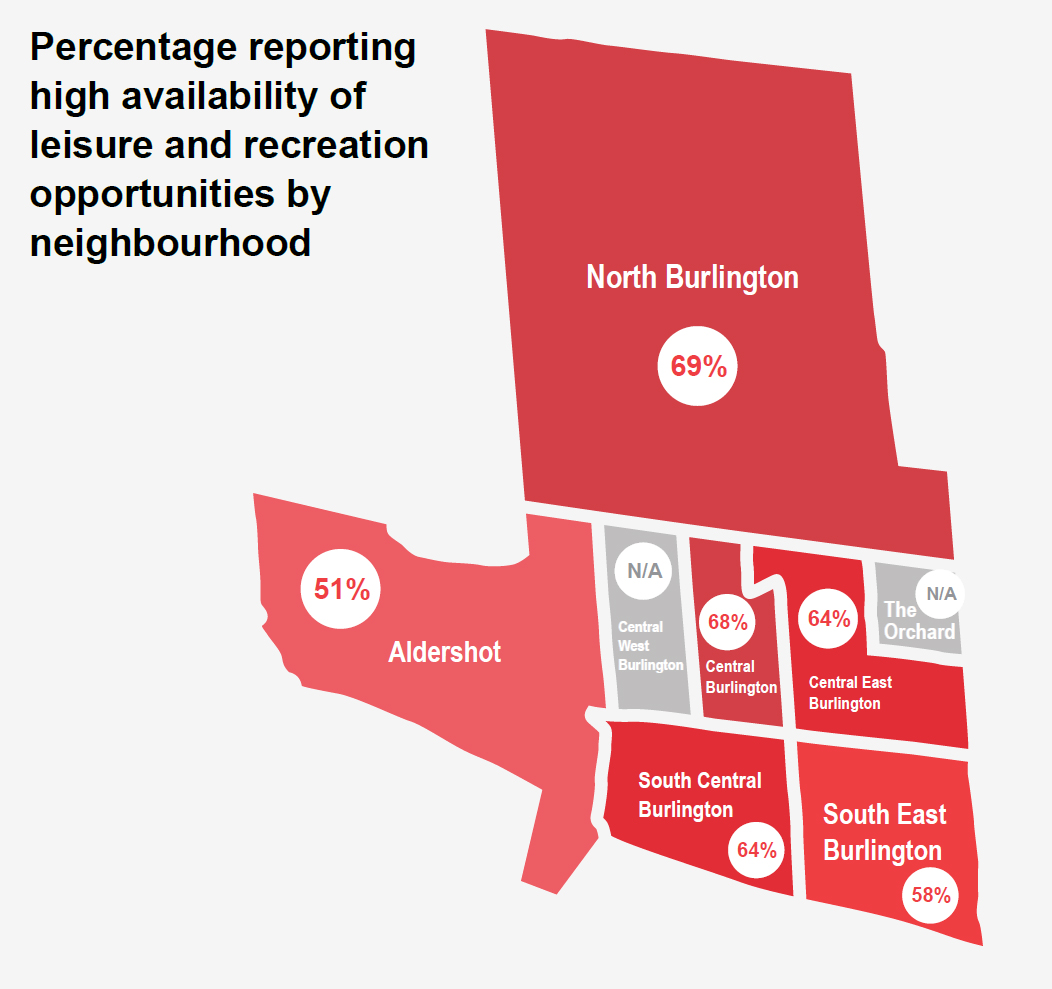
Burlington
Population*
0-6 yr.-olds
12,625
-5.1% since 2016
7-12 yr.-olds
12,730
-2.8% since 2016
13-18 yr.-olds
13,510
+4.8% since 2016
63%
reported high availability of leisure and recreation opportunities.
61%
were satisfied with the quality of recreation and culture facilities.
50%
reported barriers accessing recreation.
24%
reported systemic barriers to accessing recreation.
Equity deserving children and youth, who may need support accessing recreation and leisure opportunities:
15% of elementary and secondary students are registered for special education**.
27% of kindergarten children developmentally vulnerable in at least one domain (2018)***.
3.3% of the population lives at or below the low-income threshold*.
Halton Hills
Population*
0-6 yr.-olds
4,275
-4.7% since 2016
7-12 yr.-olds
4,675
-8.8% since 2016
13-18 yr.-olds
5,420
-1.6% since 2016
62%
reported high availability of leisure and recreation opportunities.
52%
were satisfied with the quality of recreation and culture facilities.
56%
reported barriers accessing recreation.
38%
reported systemic barriers to accessing recreation.
Equity deserving children and youth, who may need support accessing recreation and leisure opportunities:
18% of elementary and secondary students are registered for special education**.
29% of kindergarten children developmentally vulnerable in at least one domain (2018)***.
3.8% of the population lives at or below the low-income threshold*.
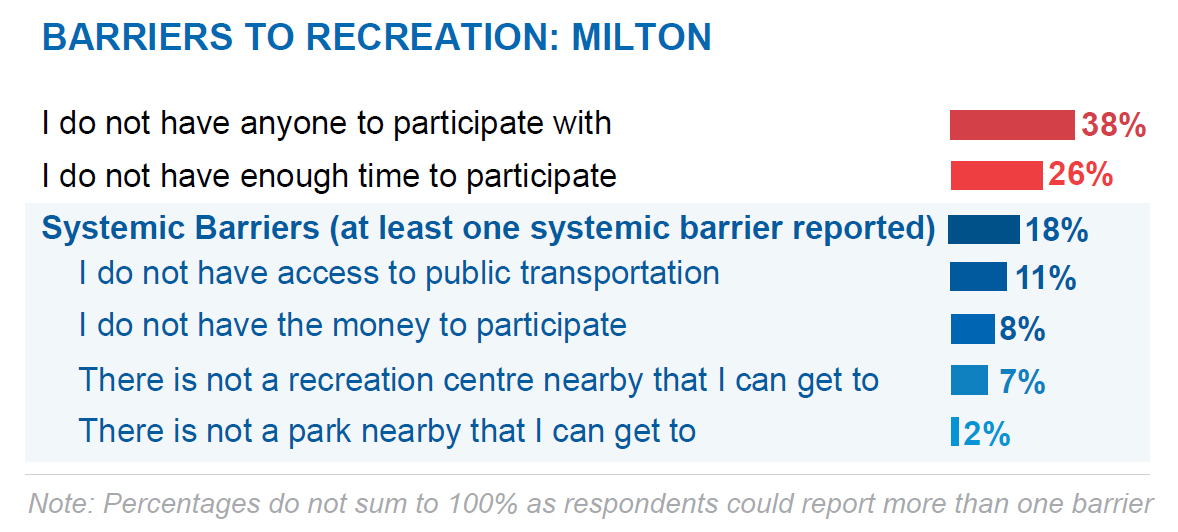
Milton
Population*
0-6 yr.-olds
13,100
-2.4% since 2016
7-12 yr.-olds
14,090
+18.3% since 2016
13-18 yr.-olds
12,690
+53% since 2016
62%
reported high availability of leisure and recreation opportunities.
62%
were satisfied with the quality of recreation and culture facilities.
54%
reported barriers accessing recreation.
18%
reported systemic barriers to accessing recreation.
Equity deserving children and youth, who may need support accessing recreation and leisure opportunities:
11% of elementary and secondary students are registered for special education**.
29% of kindergarten children developmentally vulnerable in at least one domain (2018)***.
2.4% of the population lives at or below the low-income threshold*.
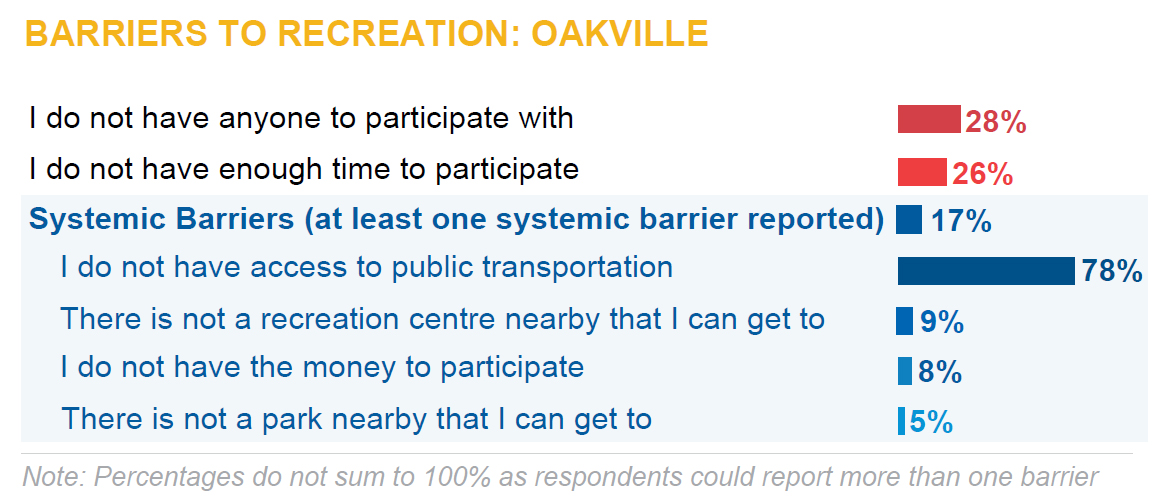
Oakville
Population*
0-6 yr.-olds
14,080
+2.6% since 2016
7-12 yr.-olds
17,575
+3.2% since 2016
13-18 yr.-olds
20,335
+13.8% since 2016
75%
reported high availability of leisure and recreation opportunities.
71%
were satisfied with the quality of recreation and culture facilities.
49%
reported barriers accessing recreation.
18%
reported systemic barriers to accessing recreation.
Equity deserving children and youth, who may need support accessing recreation and leisure opportunities:
11% of elementary and secondary students are registered for special education**.
29% of kindergarten children developmentally vulnerable in at least one domain (2018)***.
5.7% of the population lives at or below the low-income threshold*.
* Source: Statistics Canada, 2021 Census Profile.
** Source: Board School Identification Database (BSID) / Ontario School Information System (OnSIS) as updated/maintained by boards July 2023 OnSIS Preliminary 2020-2021 (Student Population)
*** The EDI is a population-based tool used to assess children’s development in five key domains. This percentage shows kindergarten children vulnerable in at least one of the domains. To learn more: https://ourkidsnetwork.ca/wp-content/uploads/2023/04/OKN-EDI-Report-2003-2018_FNL.pdf
Limitations
- This bulletin covers only responses of youth in the 13-18 age range.
- Open invitation sampling strategy (non-probabilistic).
- Sample is not necessarily representative of all children and youth living in Halton.
- It is not possible to determine a response rate.
- However, considering the geographic coverage and the size of the final sample, it’s fair to assume that we have a reasonably good cross-section of children and youth living in Halton.
- A higher degree of diversity within this sample calls for caution when interpreting overall ratios. For more details on the composition of the sample see the sociodemographic table.
- The data are meant to provide a snapshot of youth wellbeing during COVID, and caution should be used when comparing across time.
- While each indicator is important, using multiple indicators as evidence of strengths and needs provides a more comprehensive representation.
- This is a self-report survey and several types of response bias have been identified related to self-report surveys. Use caution when interpreting the findings.
