Youth Wellbeing and Access to Recreation
Breaking Down Barriers, Fostering Social Connectedness, so all Youth can Thrive


Are recreation and leisure opportunities accessible to all children and youth in Halton?

Findings reflect the responses of 1915 youth in the 13 to 18 age range.


1 Gao, M., Smale, B., Wells, E., & Redoschi, B. (2023). Moderating effect of perceived quality of and access to recreation opportunities on the relationship of leisure and wellbeing among children and youth. 17th Canadian Congress on Leisure Research. Ottawa.
Recreation and Access: the numbers
In the Halton Youth Impact Survey, 60% of youth were satisfied with the quality of recreation and cultural facilities in their communities. Sixty percent of youth reported high availability of recreation opportunities.
The 40% of youth who did not have recreation opportunities available to them were more likely to report lower levels of wellbeing* than their peers who had recreation opportunities available to them.
* High social isolation, lower life satisfaction, lower scores in supportive relationships in their lives.
of respondents reported
high availability of leisure
and recreation opportunities.
high availability of leisure
and recreation opportunities.

of respondents reported high availability of leisure and recreation opportunities
of respondents were satisfied
with the quality of recreation
and culture facilities.
with the quality of recreation
and culture facilities.

of respondents were satisfied with the quality of recreation and culture facilities.
Percentage of youth reporting high availability of
recreation opportunities by municipality

Barriers to Recreation

Barriers to Recreation

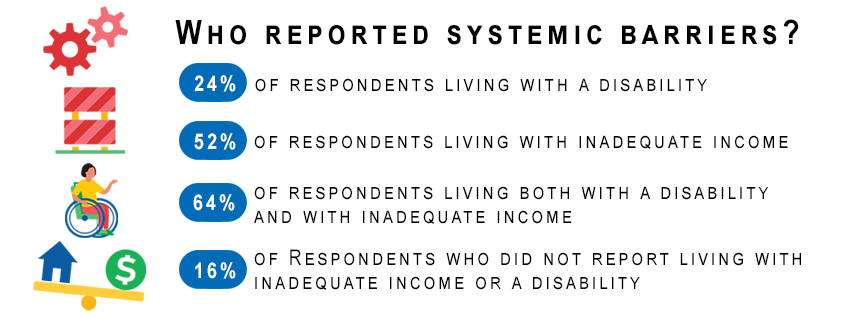
Systemic Barriers
Percentage of respondents who experienced at least one systemic barrier in accessing recreation.

24% of respondents living with a disability.

52% of respondents living in households with inadequate income.

64% of respondents living with a disability AND in a household with inadequate income.

16% of other respondents experienced systemic barriers in their access to recreation.
Limitations
- This bulletin covers only responses of youth in the 13-18 age range.
- Open invitation sampling strategy (non-probabilistic).
- Sample is not necessarily representative of all children and youth living in Halton.
- It is not possible to determine a response rate.
- However, considering the geographic coverage and the size of the final sample, it’s fair to assume that we have a reasonably good cross-section of children and youth living in Halton.
- A higher degree of diversity within this sample calls for caution when interpreting overall ratios. For more details on the composition of the sample see the sociodemographic table.
- The data are meant to provide a snapshot of youth wellbeing during COVID, and caution should be used when comparing across time.
- While each indicator is important, using multiple indicators as evidence of strengths and needs provides a more comprehensive representation.
- This is a self-report survey and several types of response bias have been identified related to self-report surveys. Use caution when interpreting the findings.
