Relationships are the Roots of Positive Development
Belonging and Connectedness for Halton Youth


Do young people in Halton have strong relationships and a sense of belonging, and how can we help them feel connected?

Findings reflect the responses of 1915 youth in the 13 to 18 age range.
Belonging and relationships in Halton: the numbers
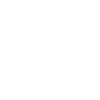
Belonging

Girls living with a chronic illness or disability were less likely to feel they belonged to their community (compared to girls that did not report a chronic illness or disability).

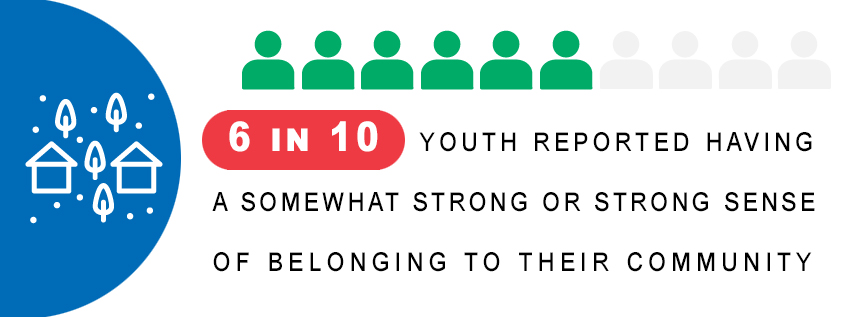
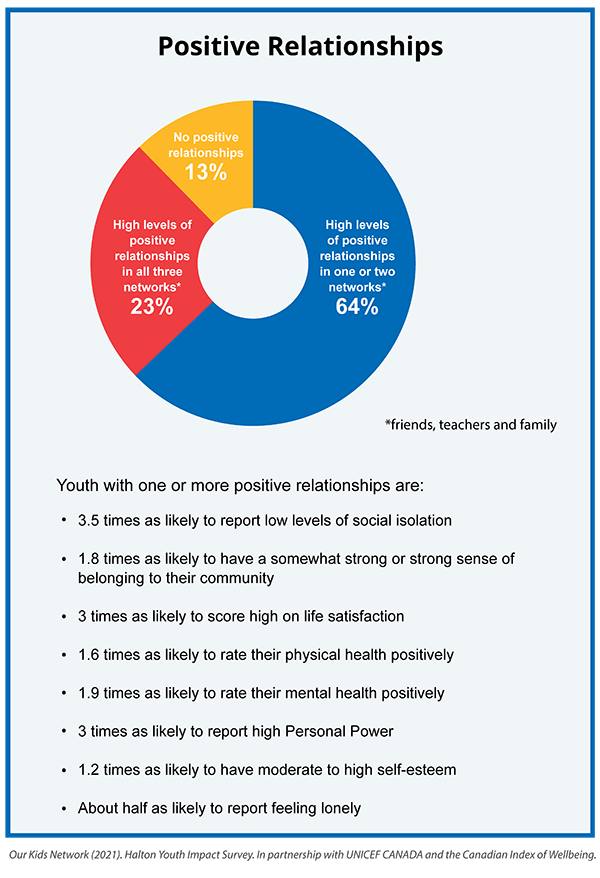
Positive Relationships

Youth identifying as Indigenous and youth living with a chronic illness or disability were less likely to report having at least one strong positive relationship.
Youth rating their life satisfaction as high
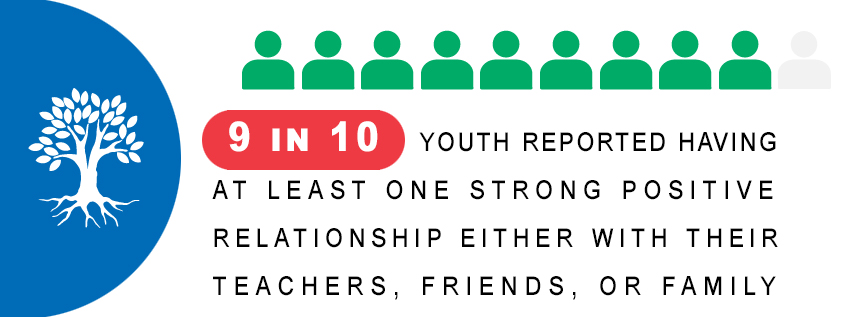
Social Isolation and Loneliness


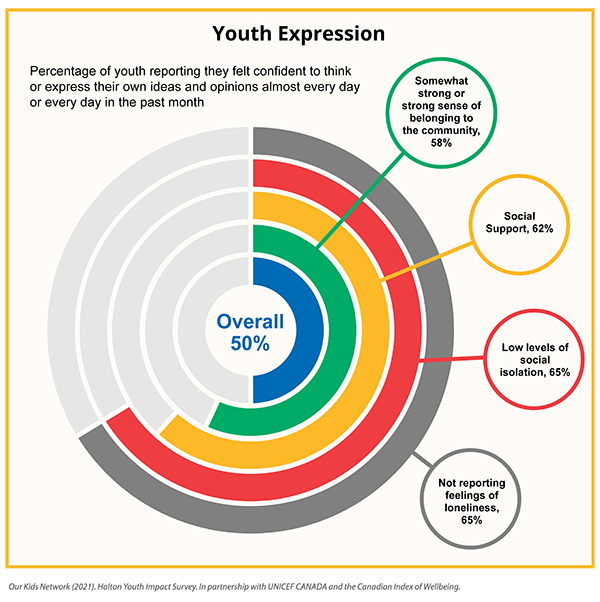
Youth Expression

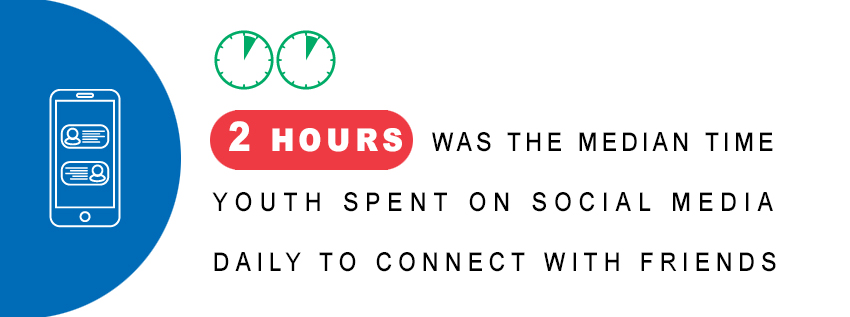
Social Media

Youth reporting higher amounts of time (more than 3.5 hours) spent daily on social media were 28% more likely to report positive relationships with their friends, but there were no differences regarding belonging, social isolation, and loneliness.
Girls as compared to boys and youth in the 16 to 18 age range as compared to those in the 13 to 15 age range, were more likely to report higher amounts of time spent daily on social media. Youth identifying as Indigenous were less likely to spend higher amounts of time on social media on a typical day.
The majority of youth in Halton had access to the internet. Ninety-one percent reported that they often or very often use the internet when they want or need it. However, youth identifying as Indigenous and youth living with a chronic illness or disability were less likely to report the same level of access to the internet. Restrictions on internet access may impact social media use.

Limitations
- These findings cover only responses of youth in the 13-18 age range
- Open invitation sampling strategy (non-probabilistic)
- Sample is not necessarily representative of all children and youth living in Halton.
- It is not possible to determine a response rate.
- However, considering the geographic coverage and the size of the final sample, it’s fair to assume that we have a reasonably good cross-section of children and youth living in Halton.
- A higher degree of diversity within this sample calls for caution when interpreting overall ratios. For more details on the composition of the sample see the sociodemographic table
- The data are meant to provide a snapshot of youth wellbeing during COVID, and caution should be used when comparing across time.
- While each indicator is important, using multiple indicators as evidence of strengths and needs provides a more comprehensive representation
- This is a self-report survey and several types of response bias have been identified related to self-report surveys. Use caution when interpreting the findings
