Building for the Future
How Youth in Halton Engage in Caring for their Communities and the Environment


Findings from the Halton Youth Impact Survey
These findings explore differences across municipalities and neighbourhoods, recognizing that strong neighbourhoods help children thrive. Our Kids Network (OKN) partners, researchers, and community professionals have identified 27 different neighbourhoods[ii]Our Kids Network (2019). Municipal, Ward and OKN Neighbourhood. Map Retrieved from https://www.ourkidsnetwork.ca/Public/Page/Files/municipal-profiles/130_MAP_OKN_neighbourhoods_Halton_wards_and_municipalities_03-19%20_Copy.pdf for collecting, analyzing, and sharing important local research – one of the hallmarks of OKN’s work in Halton. The borders of each neighbourhood reflect Statistics Canada census boundaries, and natural, transportation, municipal and regional boundaries.
When comparing municipalities, it is important to consider the sample distribution (below). The composition of the municipal sample may contribute to the observed differences between municipalities and is relevant to better understanding the data from an equity and diversity lens. The significant differences[iii]For the overall sample, differences between age groups, genders, and
other individual characteristics were initially tested using Poisson regressions
including gender and age as control. Statistically significant differences between
municipalities were identified using pairwise proportion tests, collapsing across
age, gender and other sociodemographic variables. The threshold for statistically
significant differences was p<0.05 for all statistical tests. between percentages highlighted in this bulletin do not account for differences in distribution, such as age, gender, or other important sociodemographic characteristics.
It is essential to explore these key findings with other sources of information and to hear from youth themselves. These findings are intended as a conversation starter. It is one more piece of information to add to what you already know about children, youth, and families in Halton.
Having more volunteer opportunities for youth would allow us to learn new things and connect with each other.

Youth Environmentalism and volunteerism in Halton: the numbers
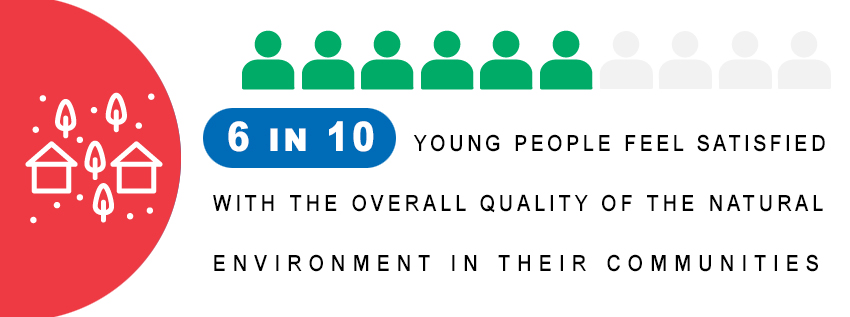
Satisfaction with the natural environment measures agreement with four items: “The quality of the natural environment in my neighbourhood is very high,” “There are plenty of opportunities to enjoy nature in my neighbourhood,” “The air quality in our community is very good,” and “The water quality in our community is very good.” Overall satisfaction was defined by a mean of four or five (equivalent to “agree” and “strongly agree”).
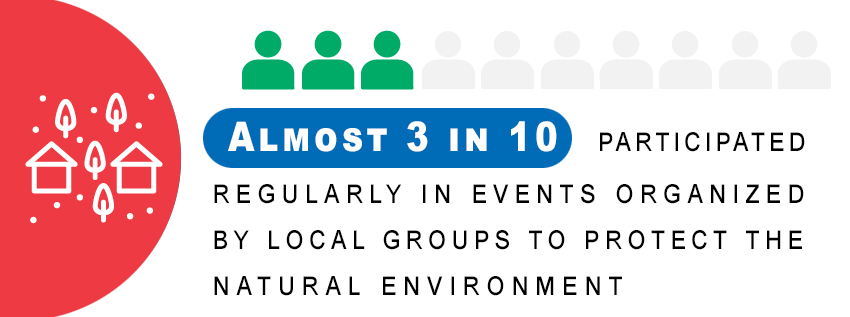
Environmentalism captures agreement with two indicators: “I feel I have a personal responsibility to protect the natural environment” and “I regularly participate in events organized by local groups to protect the natural environment” (e.g., protests, fundraising, community clean-ups).
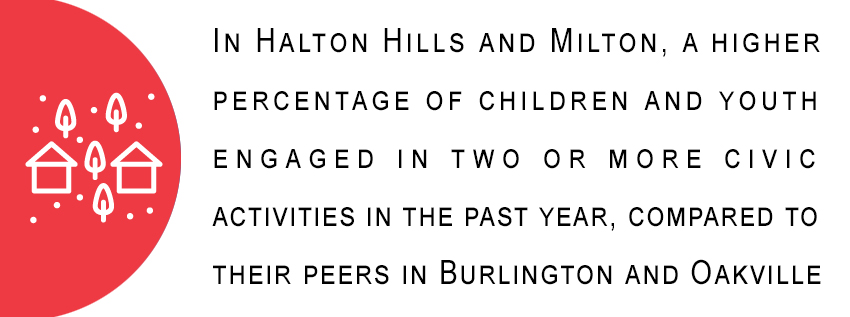
Civic Engagement measures participation in civic advocacy activities in the past 12 months (see table below for a list of activities). Children and youth engaging in at least one activity were classified as having some civic engagement, and those engaged in two or more activities were considered as having high civic engagement.
Volunteerism measures the percentage of youth regularly engaged in volunteering or helping without pay in their community. The four-point scale ranged from “Rarely” to “Always”, and answers “Often” and “Always” were classified as regular volunteering. It is important to note that volunteering rates may be partly influenced by “mandatory” volunteering, which includes required unpaid activity by a school, employer, court, or other organization.
Community Caring measures the percentage of youth reporting that they place a high value on helping other people. Community Caring included two items: “I help to make my community a better place”, and “I serve others in my community”. The 4-point items ranged from “Rarely” to “Always”. Scores equivalent to averaging “Often” between the two items were classified as high community caring. These items were developed by the OKN Research Committee and were included on the Halton Youth Survey (2009, 2012).[iv]Our Kids Network (2013). Halton Youth Survey: Community Profile 2012-13. Retrieved from https://www.ourkidsnetwork.ca/Public/Page/Files/130_
Res_HYS-HYPS_hys_community_profile_2012.pdf
I wish that my community had more groups and associations where we can connect, volunteer and help the environment. I’ve never heard of such group[s] in my community.
Halton

Newcomer youth were also more likely to report regularly volunteering or engaging in activities to protect the natural environment (independent of age and gender), compared to participants born in Canada. However, those born in Canada were more likely to report high civic engagement than those who had immigrated to Canada. Visible minority youth were more likely to report high civic engagement compared to their white peers (independent of gender and age).
The findings below are categorized by municipality and neighbourhood. Significant differences for each municipality are highlighted. It is important to note that youth in Halton may face barriers in accessing green areas and public transportation, which can impact engagement in environmental initiatives, supporting communities and overall enjoyment of natural surroundings. See table below for a breakdown of barriers reported by neighbourhood.
Having more green areas is especially important because there is so much construction and this causes bad air quality.

Burlington


Burlington is best described as a modern city with all of the charm and feel of a small town. Our community is woven tight through our penchant for highlighting historical elements (like our world-renowned Teen Tour Band) in addition to ushering in new traditions like the city’s annual Sound of Music Festival and Ribfest. Nature is deeply integrated into Burlington through the city’s waterfront access to Lake Ontario and luscious Royal Botanical Gardens.
The overall percentage of youth reporting high civic engagement in Burlington (30%) was significantly smaller than that of Halton Hills (40%) and Milton (38%). Engagement in actions to protect the natural environment ranged from 26% to 41%. Across all Burlington neighbourhoods, young people in Central West Burlington reported the highest percentage of environmental engagement volunteerism, and high levels of civic engagement.

Halton Hills


I run my own landscaping business, so I get to enjoy the outdoors in Acton every day. I like that this is a small town, and you practically know everyone.
In Halton Hills, the proportion of youth reporting high levels of satisfaction with their natural environment was significantly smaller than in Burlington, Milton, or Oakville. Even though the percentage of youth engaging in events to protect the natural environment was similar to that of other municipalities, in Halton Hills, the percentage of youth who reported feeling a personal responsibility towards protecting the environment was significantly smaller than the other three Halton municipalities. In contrast, the percentage of youth reporting high levels of civic engagement was significantly greater for Halton Hills compared to Oakville and Burlington and on par with that of Milton.
Acton had the highest percentage of young people regularly participating in events to protect the natural environment, volunteerism and high civic engagement. However, Acton had the smallest percentage of youth who reported feeling highly satisfied with their natural environment.

Milton


I love the outdoor events my community has in the spring and summer. I love our farmers markets and the amazing strawberry festival hosted at the Milton fairgrounds in July. If you’re not from Milton, I urge you to check out some of the wonderful creeks and trails we have spread out throughout the town!
In Milton, the percentage of youth that reported being highly satisfied with their natural environment is significantly lower than that of Oakville, on par with Burlington and greater than Halton Hills. The percentage of young people with high levels of civic engagement is similar to that of Halton Hills, but significantly greater than that of Oakville and Burlington.
Escarpment has the highest percentage of youth engaging in events to protect the natural environment. Volunteerism ranges from 28% to 45%, with Lower East Milton at the top of the range. Lower East Milton also has the highest percentage of youth reporting high civic engagement, at 47%.

Oakville


Safe, peaceful, beautiful landscapes; there is nothing not to like about Oakville! I love the squirrels and the birds, the parks, and the stores – but most importantly the kind, inclusive people who make this town all the better. Feel free to check out the green environment that is present in our community, even if you’re not from Oakville!
The percentage of children and youth in Oakville reporting high satisfaction with their natural environment is significantly larger than that of the three other municipalities. The percentage of young people engaging in initiatives to protect the environment ranged from 18% to 28% across Oakville neighbourhoods. North Central Oakville had the highest percentage of youth reporting high levels of environmental engagement (28%) and volunteerism (64%). North Central Oakville was also the neighbourhood with the largest percentage of youth reporting high civic engagement, at 44%.

Suggested citation: Our Kids Network (2023). Building for the future: how youth in Halton engage in caring for their communities and the environment. 2021 Halton Youth Impact Survey.
Limitations
- Open invitation sampling strategy (non-probabilistic)
- Sample is not necessarily representative of all children and youth living in Halton.
- It is not possible to determine a response rate.
- However, considering the geographic coverage and the size of the final sample, it’s fair to assume that we have a reasonably good cross-section of children and youth living in Halton.
- A higher degree of diversity within this sample calls for caution when interpreting overall ratios. For more details on the composition of the sample see the sociodemographic table
- The data are meant to provide a snapshot of youth wellbeing during COVID, and caution should be used when comparing across time.
- While each indicator is important, using multiple indicators as evidence of strengths and needs provides a more comprehensive representation
- This is a self-report survey and several types of response bias have been identified related to self-report surveys. Use caution when interpreting the findings
